Phase diagrams are essential tools in chemistry and thermodynamics. They visually represent how a substance changes between solid, liquid, and gas phases under different conditions such as temperature and pressure.
Scientists and engineers use phase diagrams to understand how materials behave, predict phase changes, and design industrial processes. These diagrams help explain everyday phenomena such as melting ice, boiling water, and the formation of crystals, while also guiding complex systems used in chemical manufacturing and materials science.
Understanding phase diagrams allows chemists to analyze how substances transition between states of matter and how environmental conditions influence these changes.
What Is a Phase Diagram?
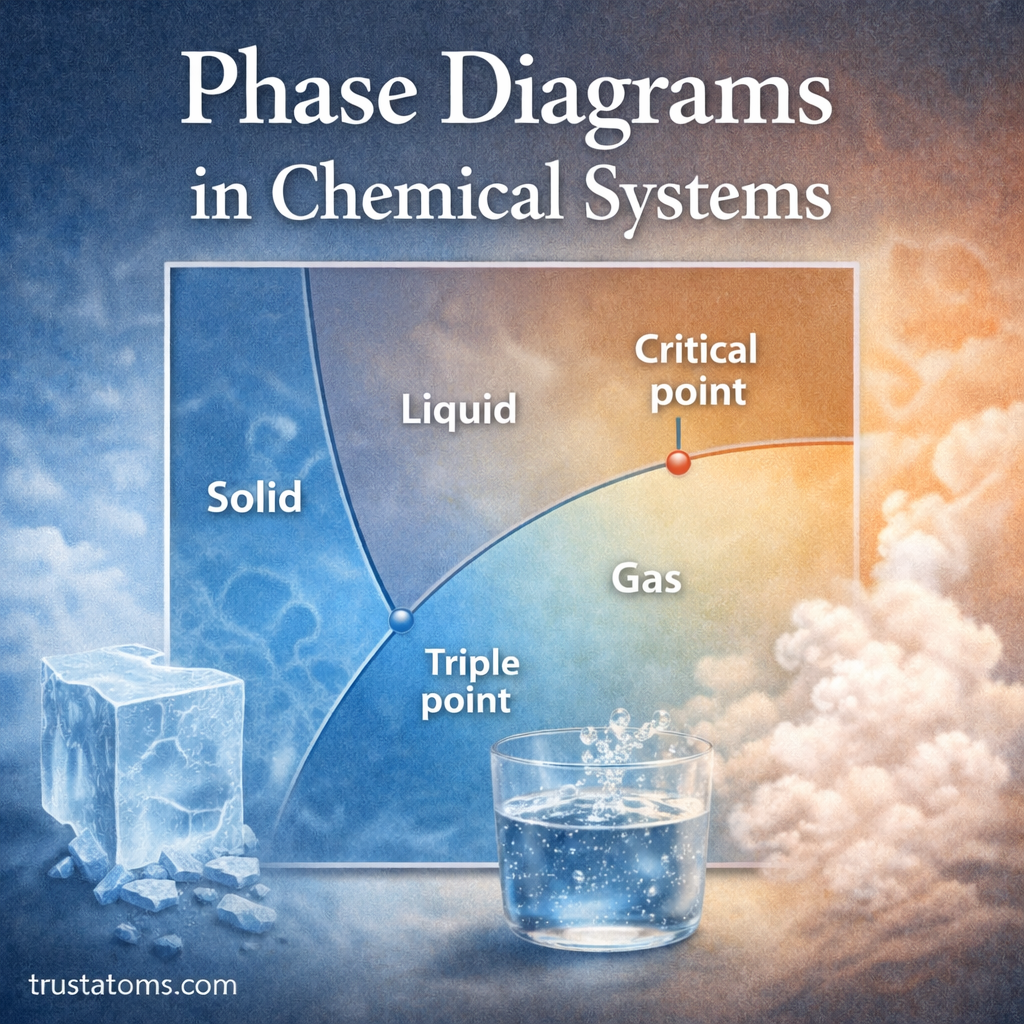
A phase diagram is a graphical representation that shows which phase of a substance is stable under different combinations of temperature and pressure.
Each region of the diagram represents a specific phase of the substance.
Typical phases shown include:
- Solid
- Liquid
- Gas
In more complex systems, additional phases may appear, such as different crystalline structures or mixtures of phases.
Phase diagrams make it possible to determine:
- Which phase exists at a given temperature and pressure
- Where phase transitions occur
- How substances behave near equilibrium boundaries
The Axes of a Phase Diagram
Most phase diagrams are plotted using two primary variables.
Temperature
Temperature usually appears on the horizontal axis. It represents the thermal energy available to particles in the system.
As temperature increases:
- Molecular motion becomes more energetic
- Solids may melt
- Liquids may vaporize
Pressure
Pressure typically appears on the vertical axis.
Pressure affects how closely molecules are packed together. Higher pressure tends to favor phases that occupy less volume, such as solids or liquids.
The interaction between temperature and pressure determines which phase is most stable.
Phase Boundaries
The lines that separate regions in a phase diagram are called phase boundaries.
Each boundary represents conditions where two phases can coexist in equilibrium.
Major phase boundaries include:
Solid–Liquid Boundary
This line represents the melting and freezing conditions.
At points along this boundary:
- Solid and liquid phases exist together
- The substance can melt or freeze depending on energy exchange
Liquid–Gas Boundary
This boundary marks the boiling and condensation conditions.
At these conditions:
- Liquid and vapor coexist
- The substance can transition between liquid and gas
Solid–Gas Boundary
This line represents sublimation and deposition.
Along this boundary:
- Solids can transform directly into gas
- Gas can deposit directly into solid form
The Triple Point
One of the most important features of a phase diagram is the triple point.
The triple point represents the exact combination of temperature and pressure where three phases coexist simultaneously.
At this point:
- Solid, liquid, and gas are all in equilibrium
- Small changes in conditions shift the system toward one phase
The triple point is unique for every substance and is often used as a reference in thermodynamic studies.
The Critical Point
Another important feature is the critical point.
At the critical point:
- The distinction between liquid and gas disappears
- The substance enters a supercritical fluid state
Supercritical fluids have properties of both liquids and gases.
They can:
- Diffuse like gases
- Dissolve substances like liquids
Supercritical fluids are widely used in industries such as:
- Food processing
- Pharmaceutical extraction
- Green chemistry technologies
Reading a Phase Diagram
Interpreting a phase diagram involves locating conditions on the graph and identifying the corresponding phase.
Follow these steps:
- Locate the temperature on the horizontal axis.
- Locate the pressure on the vertical axis.
- Find the point where the two values intersect.
- Identify the phase region where the point lies.
If the point falls on a boundary line, two phases coexist at equilibrium.
Types of Phase Diagrams
Different types of phase diagrams exist depending on the system being studied.
Single-Component Phase Diagrams
These diagrams describe the behavior of a single substance, such as water or carbon dioxide.
They show how one material changes phase under different temperature and pressure conditions.
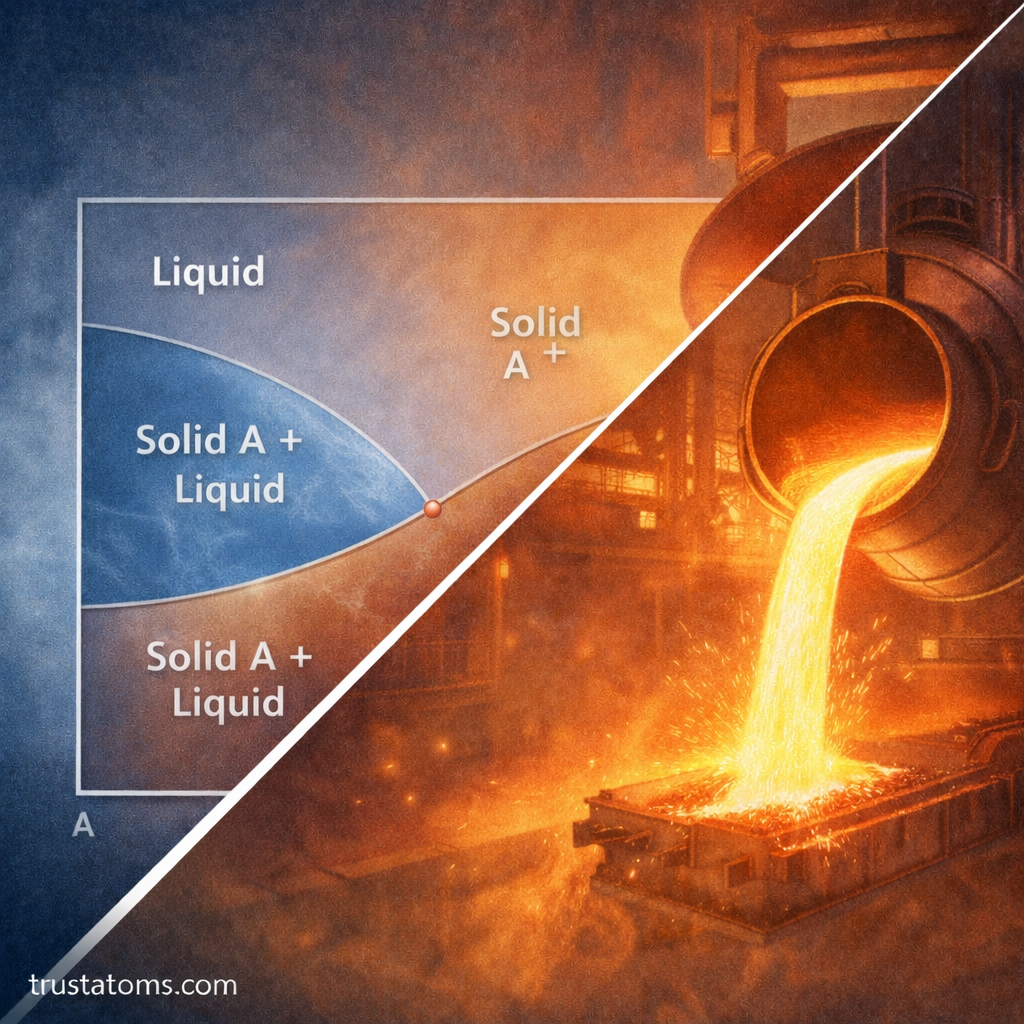
Binary Phase Diagrams
Binary phase diagrams represent systems containing two components.
They are commonly used in:
- Metallurgy
- Alloy design
- Materials science
Binary diagrams help determine how mixtures behave during heating and cooling.
Multicomponent Phase Diagrams
More complex diagrams can describe systems with multiple substances interacting.
These are often used in advanced chemical engineering and materials research.
Real-World Applications of Phase Diagrams
Phase diagrams are widely used across scientific and industrial fields.
Materials Science
Engineers use phase diagrams to design metals and alloys with specific properties.
This helps control:
- Strength
- Hardness
- Corrosion resistance
Chemical Engineering
Phase diagrams guide the design of industrial systems involving:
- Distillation
- Crystallization
- Separation processes
Environmental and Atmospheric Science
Scientists use phase diagrams to understand:
- Cloud formation
- Ice formation in the atmosphere
- Climate-related phase changes
Pharmaceutical Development
Drug manufacturing often relies on phase diagrams to control crystal formation and stability.
Why Phase Diagrams Are Important in Chemistry
Phase diagrams provide a clear framework for understanding how matter behaves under different conditions.
They allow scientists to:
- Predict phase transitions
- Analyze thermodynamic equilibrium
- Design chemical and industrial processes
- Study materials at extreme temperatures or pressures
Without phase diagrams, predicting the behavior of substances during heating, cooling, compression, or expansion would be far more difficult.
Final Thoughts
Phase diagrams are powerful tools that help scientists visualize how substances transition between solid, liquid, and gas states. By mapping temperature and pressure conditions, these diagrams reveal the boundaries where phase changes occur and highlight critical points such as the triple point and critical point.
From studying water in the atmosphere to designing advanced materials and chemical processes, phase diagrams play a crucial role in modern chemistry and engineering. They provide a structured way to understand how matter behaves across a wide range of conditions.