Reaction coordinate diagrams are visual tools used in chemical kinetics to illustrate how energy changes during a chemical reaction. These diagrams help scientists understand the progress of a reaction, including the energy required to initiate it and the formation of intermediate species along the pathway.
By mapping the energy of reactants, transition states, and products along a reaction pathway, reaction coordinate diagrams provide valuable insight into reaction mechanisms, activation energy, and catalytic effects. They are widely used in chemistry education, research, and computational modeling.
What Is a Reaction Coordinate Diagram?
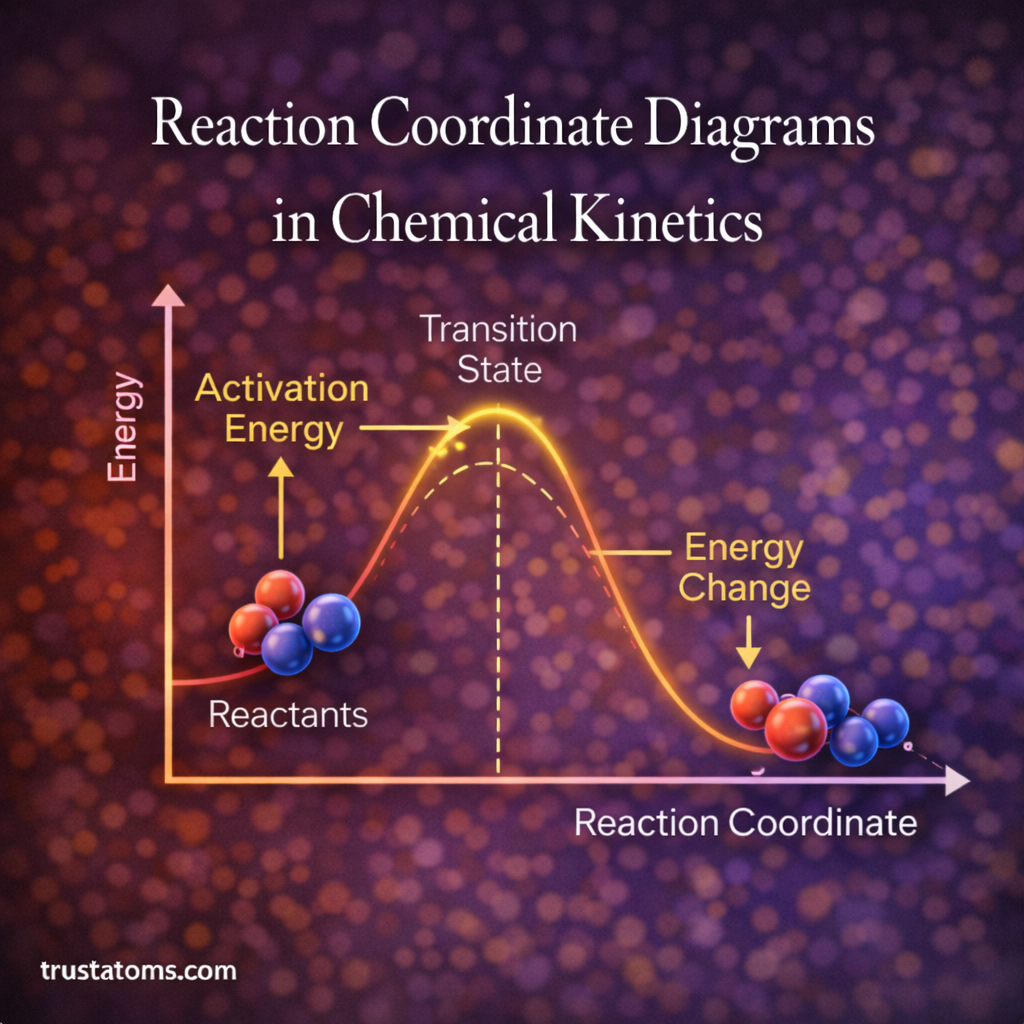
A reaction coordinate diagram is a graphical representation that shows how the potential energy of a chemical system changes as a reaction proceeds.
The horizontal axis represents the reaction coordinate, which tracks the progression of the reaction from reactants to products. The vertical axis represents the potential energy of the system.
A typical reaction coordinate diagram illustrates:
- The energy of the reactants
- The energy barrier required to start the reaction
- The transition state of the reaction
- The energy of the final products
These diagrams allow chemists to visualize how energy changes throughout the reaction process.
Key Components of a Reaction Coordinate Diagram
Understanding the major elements of reaction coordinate diagrams is essential for interpreting chemical reactions.
Reactants
Reactants appear at the beginning of the diagram. Their energy level represents the starting potential energy of the chemical system before the reaction begins.
Products
Products appear at the end of the diagram. The difference between the energy of reactants and products indicates whether the reaction releases or absorbs energy.
Transition State
The transition state is the highest point on the reaction coordinate diagram. It represents a short-lived arrangement of atoms during the reaction.
At this stage:
- Bonds are partially broken
- New bonds are partially formed
- The system reaches its maximum energy level
Because the transition state is unstable, it cannot be isolated experimentally.
Activation Energy
Activation energy is the energy required to convert reactants into the transition state.
This energy barrier determines how easily a reaction proceeds. Reactions with lower activation energy generally occur more rapidly.
Exothermic vs Endothermic Reactions
Reaction coordinate diagrams help distinguish between exothermic and endothermic reactions.
Exothermic Reactions
In an exothermic reaction, the products have lower energy than the reactants.
Characteristics include:
- Energy released during the reaction
- Negative overall energy change
- Products more stable than reactants
The diagram typically shows the energy curve ending at a lower level than it begins.
Endothermic Reactions
In an endothermic reaction, the products have higher energy than the reactants.
Characteristics include:
- Energy absorbed during the reaction
- Positive overall energy change
- Products less stable than reactants
In the diagram, the energy curve ends at a higher level than the starting point.
Reaction Mechanisms and Intermediate States
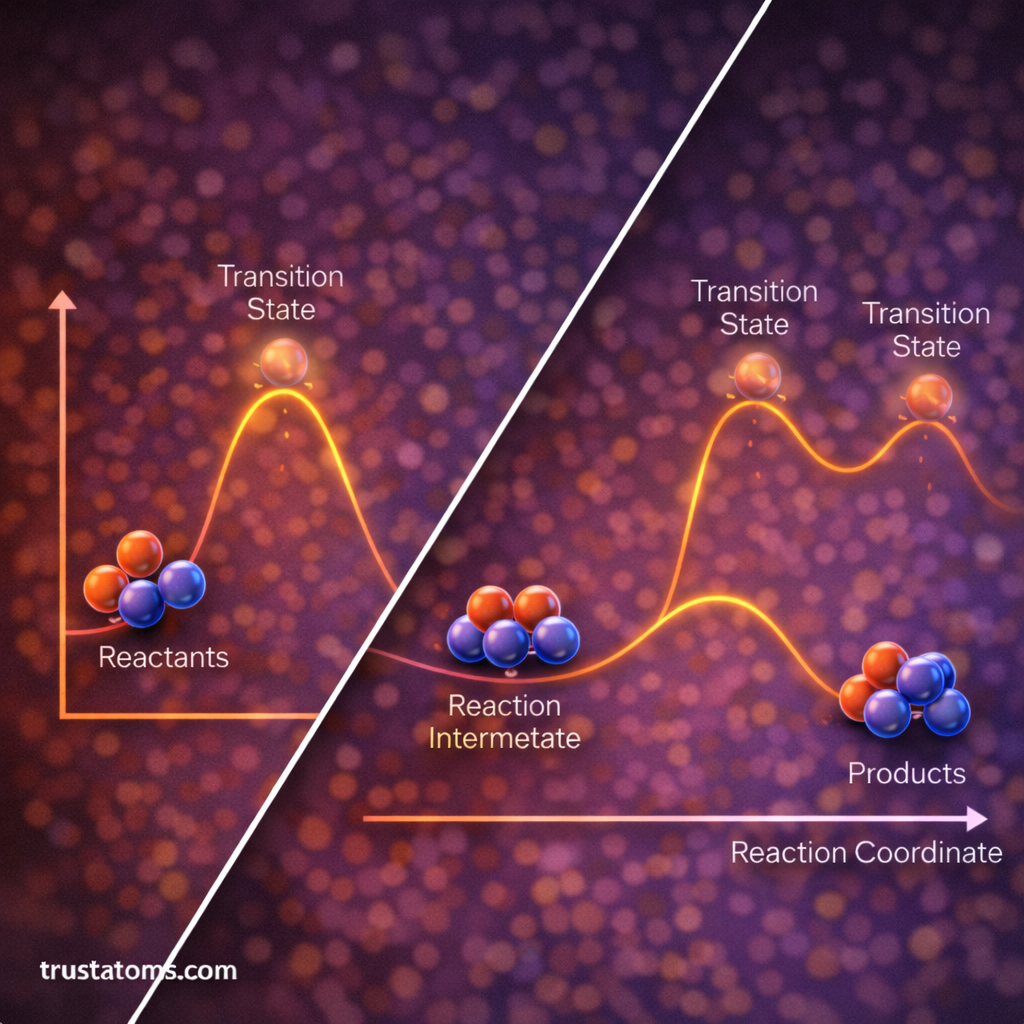
Many chemical reactions occur through multiple steps rather than a single step. Reaction coordinate diagrams can represent these multi-step reactions.
Each step may involve:
- A unique transition state
- Temporary intermediate molecules
Intermediates appear as valleys between energy peaks on the diagram.
For example, a two-step reaction may include:
- Reactants forming an intermediate
- The intermediate converting into products
Each step has its own activation energy barrier.
The Role of Catalysts in Reaction Coordinate Diagrams
Catalysts are substances that increase the rate of chemical reactions without being consumed.
Reaction coordinate diagrams clearly show how catalysts influence reactions.
A catalyst works by:
- Providing an alternative reaction pathway
- Lowering the activation energy barrier
- Stabilizing transition states
In a diagram, the catalyzed pathway appears as a lower energy peak compared to the uncatalyzed pathway.
Because the activation energy is reduced, reactions occur more quickly.
Reaction Coordinate Diagrams and Reaction Rates
Chemical kinetics focuses on how fast reactions occur. Reaction coordinate diagrams help explain the relationship between energy barriers and reaction rates.
Key insights include:
- Higher activation energy leads to slower reactions
- Lower activation energy leads to faster reactions
- Catalysts accelerate reactions by lowering energy barriers
The rate of a reaction depends on how easily molecules can reach the transition state.
Transition State Theory
Transition state theory is a fundamental concept in chemical kinetics that relates reaction rates to the formation of the transition state.
According to this theory:
- Molecules must reach the transition state before forming products
- The probability of reaching this state depends on energy and temperature
Reaction coordinate diagrams visually represent this concept by highlighting the energy barrier that must be overcome.
Applications of Reaction Coordinate Diagrams
Reaction coordinate diagrams are widely used across chemistry and related scientific fields.
Chemical Education
These diagrams help students visualize reaction pathways and understand energy changes in reactions.
Catalysis Research
Scientists use reaction coordinate diagrams to analyze catalytic mechanisms and design more efficient catalysts.
Computational Chemistry
Computational models often calculate potential energy surfaces and reaction coordinates to predict reaction mechanisms.
Pharmaceutical Development
Reaction coordinate diagrams help researchers understand how enzymes and drugs interact during biochemical reactions.
Limitations of Reaction Coordinate Diagrams
Although reaction coordinate diagrams are valuable tools, they are simplified representations of complex chemical processes.
Some limitations include:
- They typically represent one reaction pathway at a time
- They simplify multidimensional energy surfaces into two dimensions
- They do not fully capture molecular motion and environmental effects
Despite these limitations, reaction coordinate diagrams remain essential for explaining reaction mechanisms and kinetics.
The Future of Reaction Mechanism Analysis
Modern research tools are expanding how scientists analyze chemical reactions.
Advanced techniques include:
- Quantum chemical simulations
- Molecular dynamics modeling
- High-resolution spectroscopy
- Machine learning for reaction prediction
These technologies allow researchers to study reaction pathways in far greater detail than traditional diagrams alone.
Conclusion
Reaction coordinate diagrams are powerful tools for understanding chemical kinetics and reaction mechanisms. By illustrating energy changes along a reaction pathway, these diagrams reveal important features such as activation energy, transition states, intermediates, and product formation.
Whether used in education, research, or industrial chemistry, reaction coordinate diagrams provide essential insight into how and why chemical reactions occur. As computational and experimental techniques continue to advance, these diagrams will remain a fundamental concept for interpreting chemical processes.