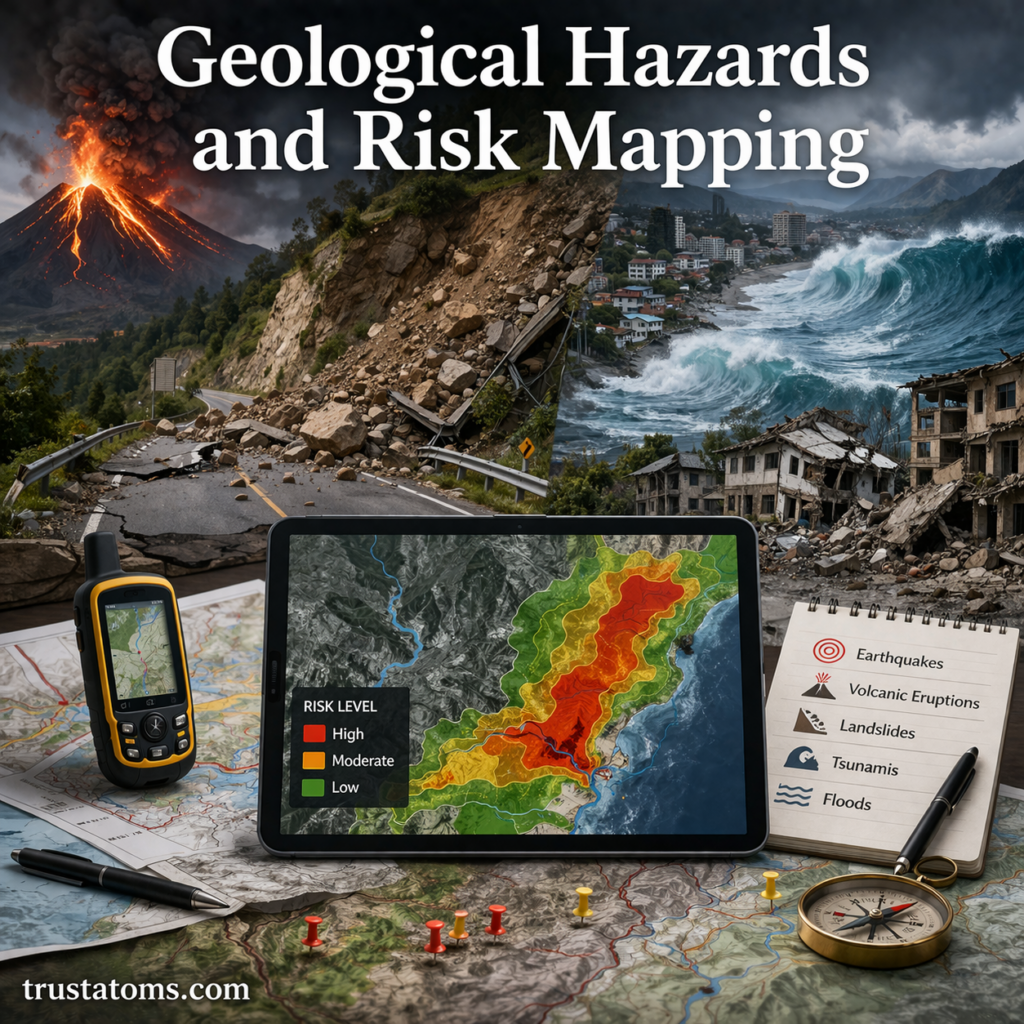
Geological hazards are natural events caused by Earth’s dynamic processes that can threaten lives, infrastructure, and the environment. From earthquakes and volcanic eruptions to landslides and tsunamis, these hazards can have devastating impacts if communities are unprepared.
Risk mapping plays a critical role in identifying vulnerable areas, helping governments, planners, and individuals make informed decisions to reduce damage and improve safety.
What Are Geological Hazards?
Geological hazards are events that originate from Earth’s structure and processes, particularly within the crust and mantle.
They can occur suddenly or develop over time, depending on the type of hazard.
Common Types of Geological Hazards
- Earthquakes
- Volcanic eruptions
- Landslides and rockfalls
- Tsunamis
- Sinkholes
- Soil liquefaction
Each hazard varies in frequency, intensity, and geographic distribution.
What Is Risk Mapping?
Risk mapping is the process of identifying, analyzing, and visualizing areas that are vulnerable to specific hazards.
It combines scientific data with geographic tools to show where hazards are likely to occur and how severe their impact could be.
Key Components of Risk Mapping
- Hazard identification (what can happen)
- Exposure (who or what is at risk)
- Vulnerability (how severely it may be affected)
- Probability (likelihood of occurrence)
Risk maps are often used in urban planning, disaster management, and insurance.
Why Geological Hazards Occur
Geological hazards are driven by natural processes within Earth.
Plate Tectonics
- Movement of tectonic plates causes earthquakes and volcanic activity
- Subduction zones often generate powerful earthquakes and volcanoes
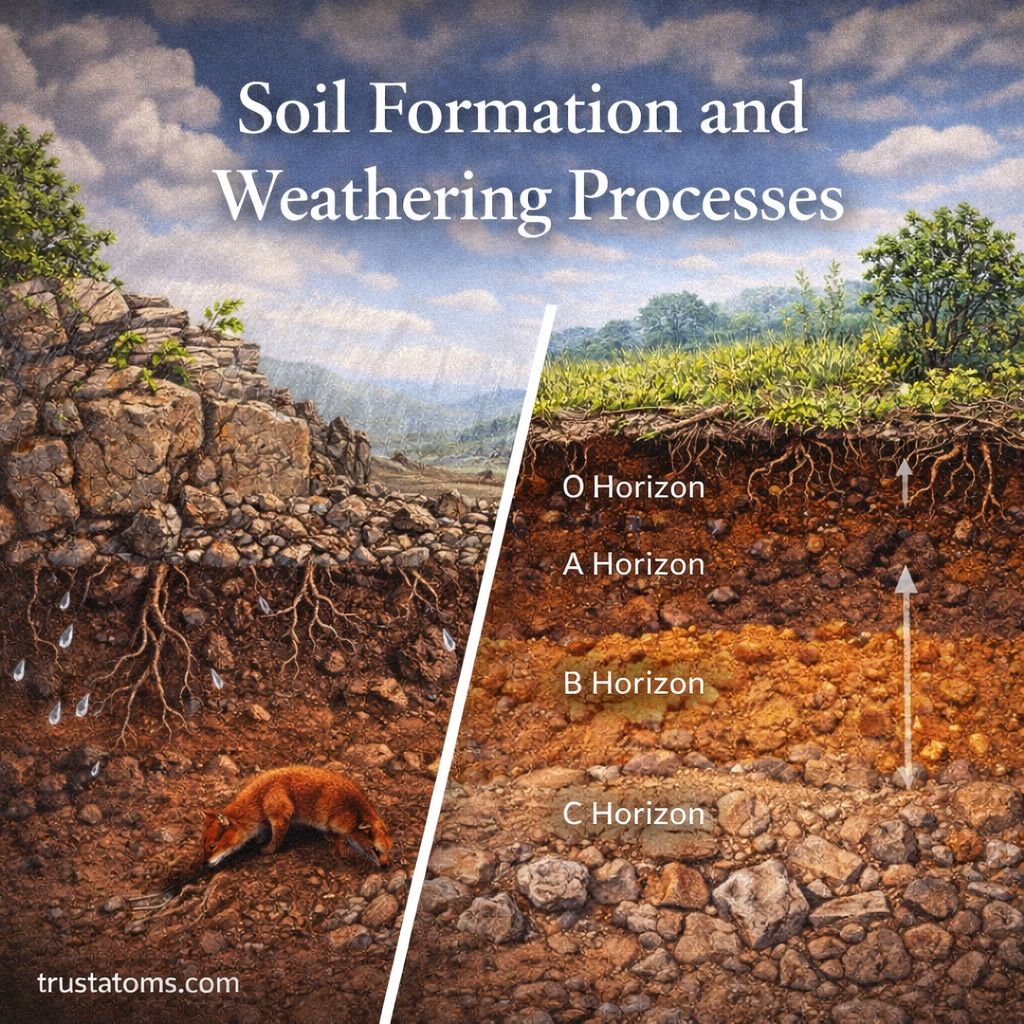
Surface Processes
- Weathering and erosion can destabilize slopes
- Heavy rainfall can trigger landslides
Human Influence
- Construction on unstable land
- Deforestation increasing landslide risk
- Groundwater extraction causing sinkholes
Types of Risk Maps
Different hazards require different types of mapping techniques.
Seismic Hazard Maps
- Show areas prone to earthquakes
- Indicate expected ground shaking intensity
Volcanic Hazard Maps
- Identify lava flow paths, ash fall zones, and eruption risks
Landslide Susceptibility Maps
- Highlight areas with unstable slopes
- Often based on rainfall, soil type, and terrain
Flood and Tsunami Maps
- Show potential inundation zones
- Used for evacuation planning
How Risk Mapping Works
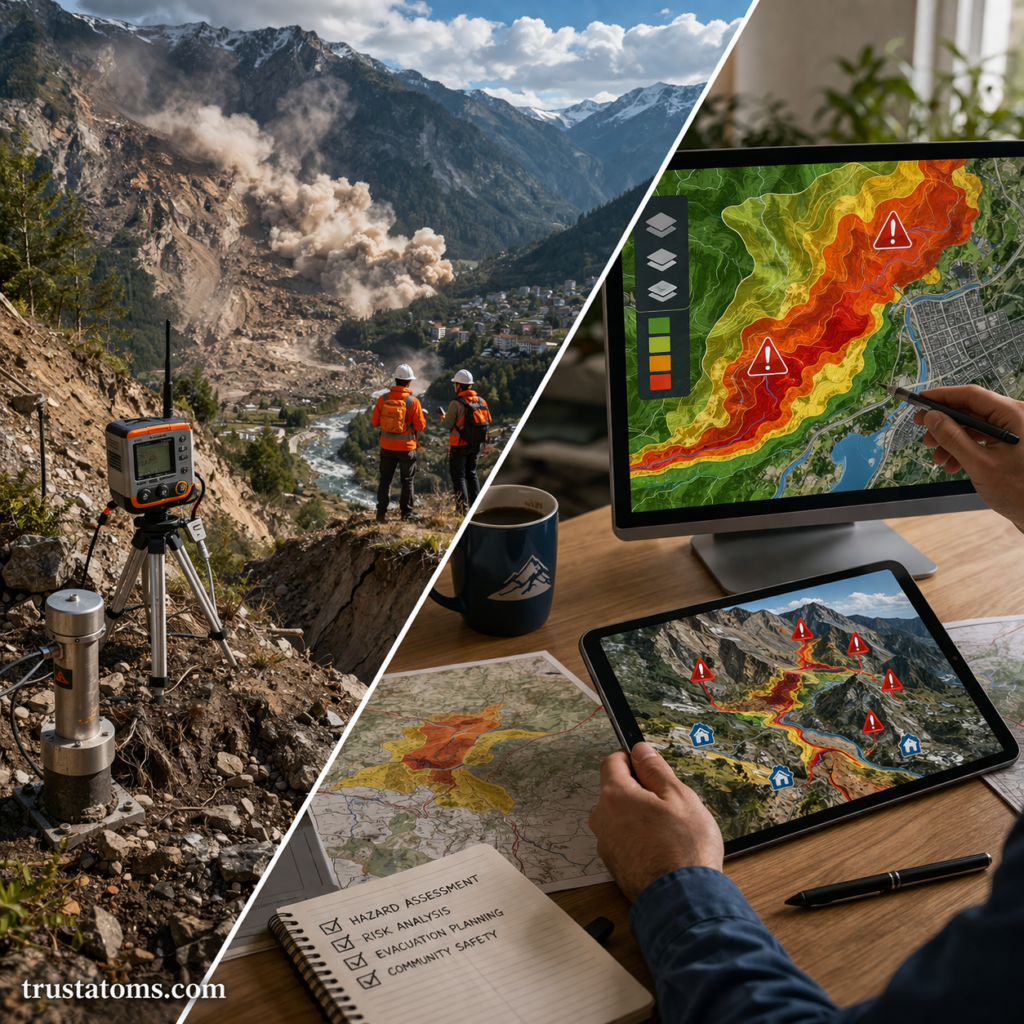
Modern risk mapping relies heavily on technology and data analysis.
Step-by-Step Process
- Collect geological and environmental data
- Analyze past hazard events
- Use geographic information systems (GIS) to map patterns
- Model potential future scenarios
- Visualize risk zones using maps and layers
These maps are continually updated as new data becomes available.
Tools Used in Risk Mapping
Risk mapping combines several advanced tools and technologies.
Geographic Information Systems (GIS)
- Used to analyze and visualize spatial data
- Allows layering of multiple risk factors
Remote Sensing
- Uses satellites and drones to gather data
- Helps monitor changes in terrain and activity
Seismic Monitoring Networks
- Detect and record earthquake activity
- Provide real-time data for hazard assessment
Importance of Risk Mapping
Risk mapping is essential for reducing the impact of geological hazards.
Urban Planning
- Helps avoid building in high-risk areas
- Guides safer infrastructure development
Emergency Preparedness
- Supports evacuation planning
- Improves disaster response strategies
Public Awareness
- Educates communities about risks
- Encourages preparedness and safety measures
Real-World Applications
Earthquake-Prone Regions
Countries like Japan and California use seismic hazard maps to guide building codes and emergency planning.
Volcanic Zones
Regions near active volcanoes use hazard maps to monitor eruption risks and establish exclusion zones.
Coastal Areas
Tsunami risk maps help coastal communities plan evacuation routes and warning systems.
Challenges in Risk Mapping
Despite advances, risk mapping faces several challenges.
Data Limitations
- Incomplete or outdated data can reduce accuracy
Unpredictability
- Some hazards occur with little warning
Rapid Urban Growth
- Expanding cities may outpace updated risk assessments
Climate Change
- Alters environmental conditions, increasing certain risks
Common Misconceptions
“Hazards Can Be Prevented”
Natural hazards cannot be stopped, but their impacts can be reduced.
“Risk Maps Are Always Exact”
Risk maps are predictive tools, not guarantees.
“Only Certain Areas Are at Risk”
Many regions face some level of geological hazard, even if it is low.
Key Takeaways
- Geological hazards include earthquakes, volcanoes, landslides, and more
- Risk mapping identifies where hazards are likely and how severe they may be
- Tools like GIS and remote sensing improve accuracy
- Risk maps support planning, safety, and disaster response
- While hazards cannot be prevented, their risks can be managed
Final Thoughts
Geological hazards are a natural part of Earth’s dynamic system, but their impact on human life can be minimized through knowledge and preparation. Risk mapping provides a powerful way to visualize danger, plan ahead, and build safer communities.
As technology continues to improve, risk maps will become even more accurate, helping societies better understand and adapt to the challenges posed by our ever-changing planet.