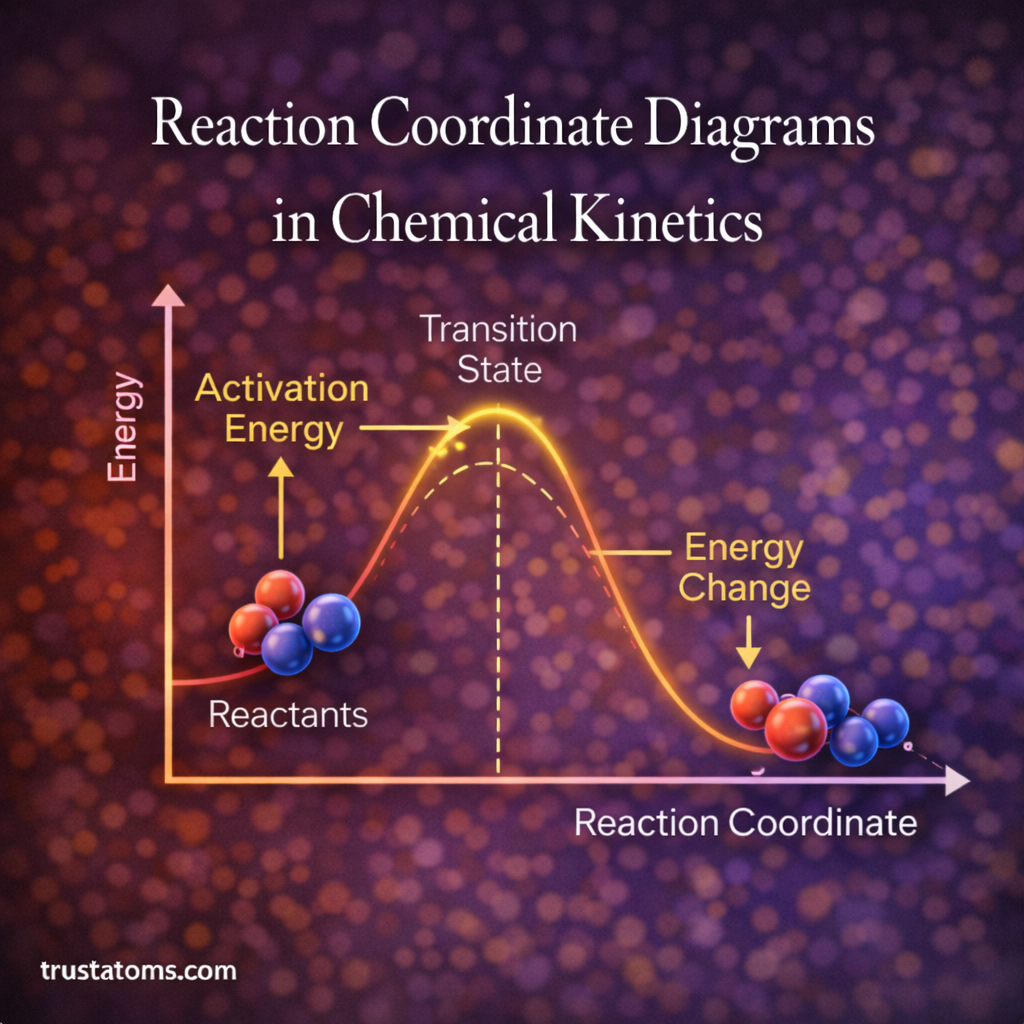
Reaction coordinate diagrams are visual tools used in chemical kinetics to illustrate how energy changes during a chemical reaction. These diagrams help scientists understand the progress of a reaction, including the energy required to initiate it and the formation of intermediate species along the pathway.
By mapping the energy of reactants, transition states, and products along a reaction pathway, reaction coordinate diagrams provide valuable insight into reaction mechanisms, activation energy, and catalytic effects. They are widely used in chemistry education, research, and computational modeling.
Continue reading “Reaction Coordinate Diagrams in Chemical Kinetics”