An electrocardiogram (ECG or EKG) records electrical activity generated by the heart as impulses travel through its conduction system and activate the heart muscle. Its characteristic P waves, QRS complexes, and T waves reveal the timing of atrial and ventricular electrical activity, helping clinicians assess heart rate, rhythm, and conduction abnormalities.
Understanding these signals connects the heart’s internal structures with their functions in human anatomy. An ECG does not directly measure blood flow or the strength of heart contractions, but it provides information about the electrical events that coordinate each heartbeat.
What Is an Electrocardiogram (ECG)?
An ECG is a noninvasive test that uses electrodes attached to the skin to detect voltage differences produced by electrical activity in the heart. These signals are displayed as waveforms that change as cardiac muscle cells depolarize and repolarize.
Depolarization is the electrical activation that helps initiate muscle contraction. Repolarization is the electrical recovery process that prepares cells for subsequent activation.
The resulting electrical sequence coordinates the mechanical phases described in the Cardiac Cycle, including contraction during systole and relaxation during diastole.
A standard 12-lead ECG provides different views of cardiac electrical activity using electrodes positioned on the limbs and chest. Each lead represents a particular electrical perspective rather than a separate heartbeat.
The Heart’s Electrical Conduction System
The heart contains specialized cells that generate and transmit electrical impulses. Their arrangement allows the atria to activate before the ventricles, supporting coordinated filling and pumping.
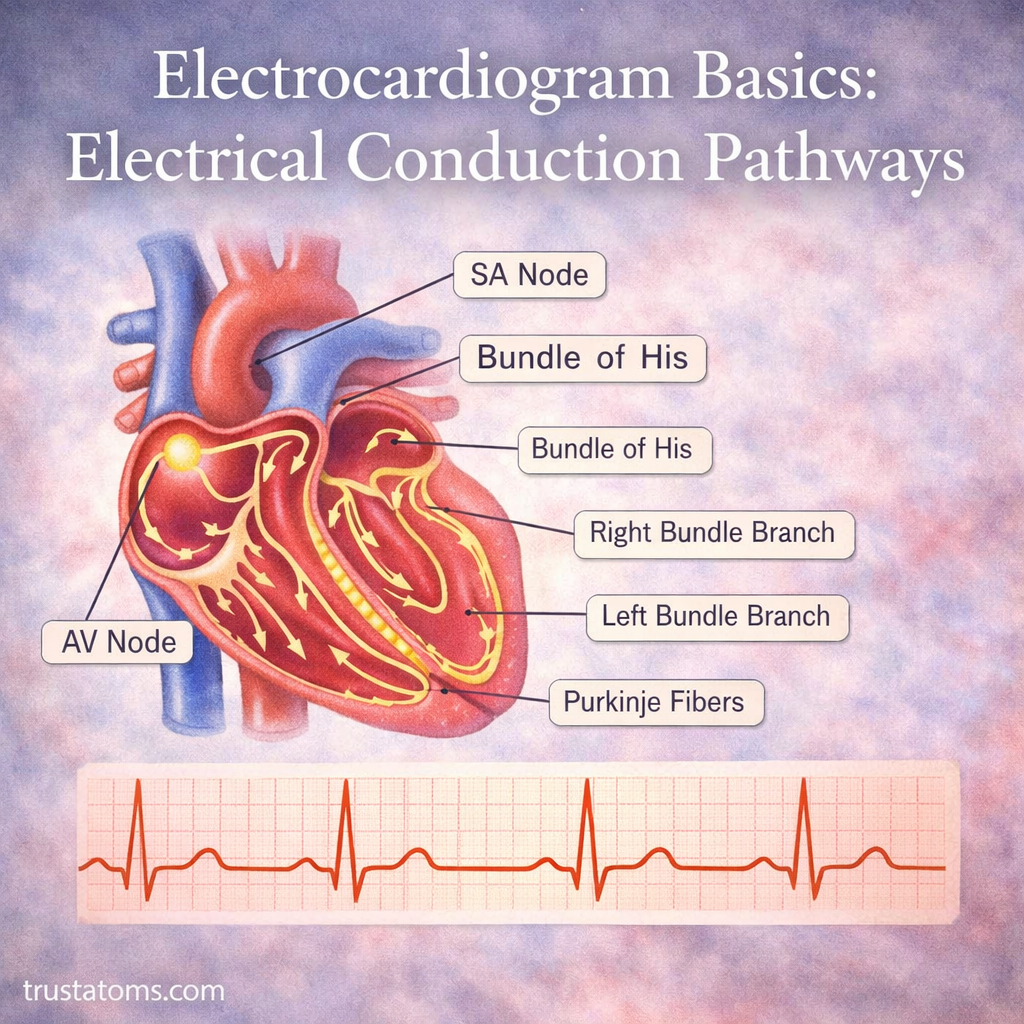
The complete sequence is examined in the Cardiac Conduction System, from the sinoatrial node to the Purkinje fibers.
Electrical activation triggers mechanical activity, but the pumping process involves additional changes in pressure and valve movement. These are explained in How the Heart Pumps Blood.
The autonomic nervous system modifies the frequency of impulses generated by the sinoatrial node. Heart Rate Control and Autonomic Regulation explains how sympathetic and parasympathetic activity influence heart rate.
Cardiac muscle also requires a continuous supply of oxygen and nutrients. The vessels responsible are described in Coronary Circulation and Heart Supply.
Step-by-Step Electrical Pathway Through the Heart
1. Sinoatrial Node: The Natural Pacemaker
The sinoatrial (SA) node is located in the right atrium near the opening of the superior vena cava. Its specialized cells spontaneously generate electrical impulses, normally establishing the rhythm of the heart.
The impulses spread through the atrial myocardium, initiating atrial depolarization and subsequent contraction.
2. Atrial Conduction and the AV Node
Electrical activation spreads through both atria and reaches the atrioventricular (AV) node. Located in the lower portion of the right atrium, the AV node conducts impulses more slowly than surrounding atrial muscle.
This delay helps provide time for ventricular filling before ventricular activation. It also limits how rapidly some atrial impulses can reach the ventricles.
3. Bundle of His and Bundle Branches
After passing through the AV node, the impulse enters the atrioventricular bundle, also called the bundle of His. This structure conducts electrical activity into the interventricular septum, where it divides into right and left bundle branches.
These pathways distribute electrical impulses toward the corresponding ventricles. The left bundle branch further divides into specialized fascicles.
4. Purkinje Fibers Activate the Ventricles
Purkinje fibers rapidly distribute impulses through the ventricular myocardium. Their fast conduction helps activate large areas of ventricular muscle within a short period, supporting coordinated contraction.
The right ventricle then pumps blood toward the lungs, while the left ventricle pumps blood into the systemic circulation.
ECG Waves and What They Represent
A normal ECG waveform reflects the combined electrical activity of many cardiac cells. Its main components correspond to specific stages of depolarization and repolarization.
| ECG component | Electrical event | What it helps assess |
|---|---|---|
| P wave | Atrial depolarization | Atrial activation and rhythm origin |
| PR interval | Time from atrial activation to ventricular activation | Atrioventricular conduction |
| QRS complex | Ventricular depolarization | Ventricular activation and conduction |
| ST segment | Period when ventricular cells are largely depolarized | Possible ischemic or other electrical changes |
| T wave | Ventricular repolarization | Electrical recovery of the ventricles |
| QT interval | Ventricular depolarization through repolarization | Overall ventricular electrical duration |
Atrial repolarization usually occurs during the QRS complex and is not separately visible on a standard ECG. Electrical activation precedes mechanical contraction, so ECG waves should not be interpreted as direct measurements of blood pumping.
Example: Calculating Heart Rate From an ECG
Imagine an ECG recorded at the standard paper speed of 25 millimeters per second. If two consecutive R-wave peaks are separated by four large grid squares, each representing 0.2 seconds, the interval between heartbeats is 0.8 seconds.
Dividing 60 seconds by 0.8 seconds gives a heart rate of 75 beats per minute. This is equivalent to the common ECG shortcut of dividing 300 by the number of large squares between R waves.
This method works best when the rhythm is regular. Irregular rhythms require different approaches, such as counting QRS complexes over a measured recording interval.
Common Electrical Conduction Abnormalities
Changes in impulse generation or conduction can alter the ECG waveform and heart rhythm. Some are harmless in particular circumstances, while others require medical evaluation.
- Sinus bradycardia: A sinus rhythm slower than 60 beats per minute in adults, which can be normal during sleep or in well-trained athletes.
- Sinus tachycardia: A sinus rhythm faster than 100 beats per minute in resting adults, sometimes occurring with exercise, fever, dehydration, or illness.
- Atrioventricular block: Delayed or interrupted conduction between atria and ventricles, ranging from first-degree delay to complete heart block.
- Bundle branch block: Delayed conduction through one of the ventricular bundle branches, often widening the QRS complex.
- Atrial fibrillation: Disorganized atrial electrical activity associated with an irregularly irregular ventricular rhythm.
ECG interpretation considers waveform patterns, symptoms, medications, and the patient’s clinical condition. An abnormal trace does not establish every diagnosis by itself.
How an Electrocardiogram Is Performed
During a standard resting ECG, a healthcare professional attaches electrodes to the chest and limbs. The patient generally lies still while the machine records electrical signals for several seconds.
The test is painless and does not send electricity into the body. It records naturally occurring electrical activity through sensors placed on the skin.
Movement, poor electrode contact, muscle activity, and electrical interference can distort recordings. Correct electrode placement is also necessary because misplaced leads may change waveform appearance and complicate interpretation.
How ECGs Help Detect Heart Conditions
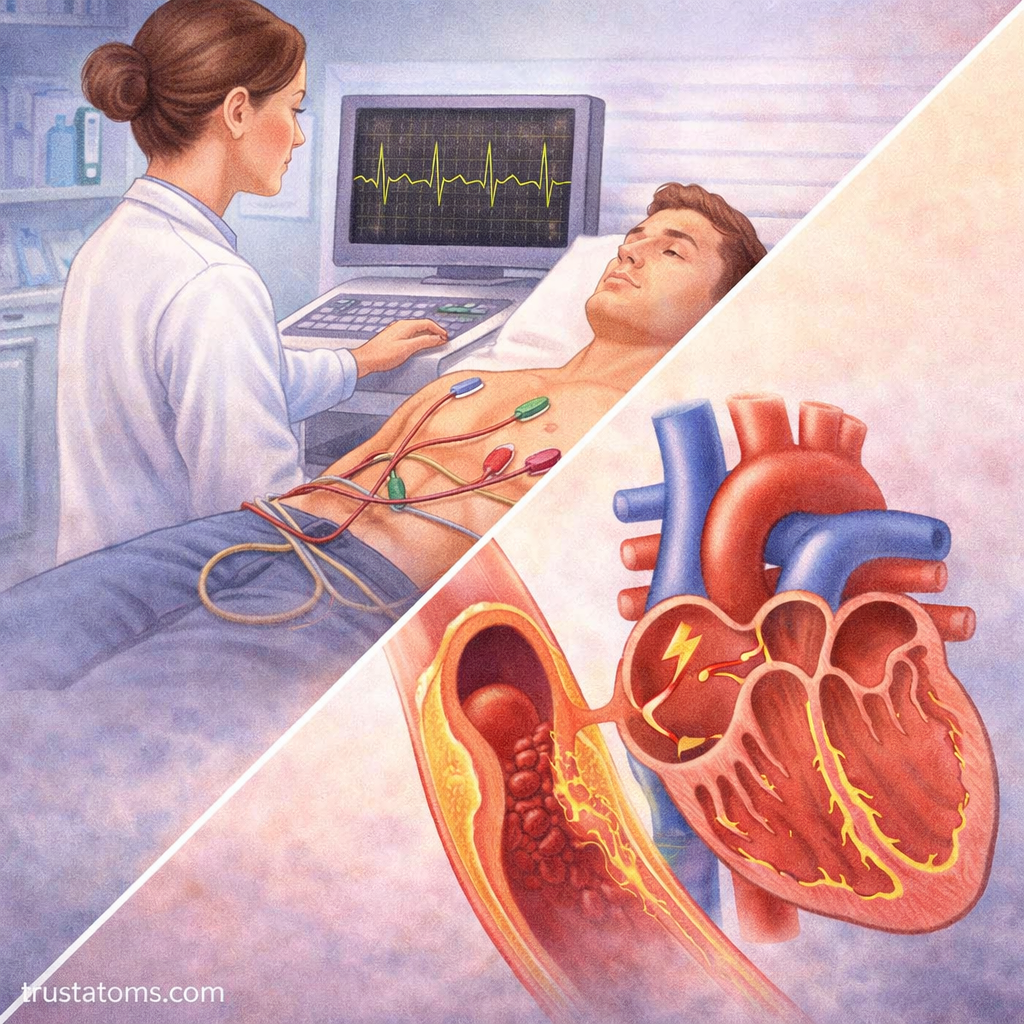
ECGs are used to investigate palpitations, dizziness, fainting, chest discomfort, and suspected rhythm disorders. They can reveal conduction delays, some electrolyte-related changes, and electrical patterns associated with myocardial ischemia or heart attack.
However, a normal ECG does not rule out every heart condition, including a heart attack. Clinicians may combine ECG findings with symptoms, blood tests such as cardiac troponin, and other examinations.
A resting ECG captures only a brief period. Intermittent rhythm problems may require longer monitoring with a Holter monitor or another ambulatory recording device.
Frequently Asked Questions
What is the difference between an ECG and an EKG?
ECG and EKG refer to the same test: an electrocardiogram. EKG comes from the German spelling of electrocardiography, while ECG uses the English abbreviation.
What does the QRS complex represent?
The QRS complex represents ventricular depolarization, the electrical activation that precedes ventricular contraction. Its duration and shape can provide information about how electrical impulses spread through the ventricles.
Can an ECG detect a blocked coronary artery?
An ECG can reveal electrical changes associated with reduced blood flow to the heart muscle, but it does not directly show coronary arteries or confirm the location of a blockage. Additional tests may be needed to determine whether coronary artery disease is present.
The ECG translates the heart’s electrical activation and recovery into recognizable waveforms, from atrial depolarization through ventricular repolarization. Understanding the SA node, AV node, bundle branches, and Purkinje fibers explains why these waves appear in a coordinated sequence. Changes in their timing or shape can help identify conduction disorders and guide further cardiac evaluation.
This article is for general education and is not medical advice. Talk to a qualified health professional about any medical concern.
Sources: Guyton and Hall Textbook of Medical Physiology; Goldberger’s Clinical Electrocardiography: A Simplified Approach; American Heart Association.